The U.S. ports on both the West Coast and the East Coast are reporting record yearly results for 2019, despite the raging trade war between the U.S. and China that was one of the hottest topics impacting trade last year.
The Port of Corpus Christi, the 3rd largest port in the United States, said it ended 2019 with record tonnages for December of 13.8 million cargo tons and 122.2 million cargo tons for the entire year — a 16-million-ton improvement over 2018 tonnages.
The port attributed the growth to increases in energy exports of crude oil and liquefied natural gas. Year over year gains in crude production led to a 26.8% jump in crude exports from the port.

Liquefied natural gas exports (LNG) increased 6.6 million tons overall (the equivalent of 316.8 billion cubic feet) in 2019 as a result of Cheniere Energy subsidiary Corpus Christi Liquefaction increasing production with the commissioning of its first train in November 2018 and its second train in late 2019, the port data shows.
“These record-setting figures are not only indicative of a resilient energy export market, but are also reflective of the large infrastructure investments made by both private industry and the Port Authority as we position the Port of Corpus Christi as the Energy Port of the Americas,” said Sean Strawbridge, Chief Executive Officer for the Port of Corpus Christi.
“We moved more than 120 million tons in 2019. The figure alone is impressive, but what is more remarkable is the exponential growth we are seeing year over year and sometimes even month over month,” said Charles W. Zahn, Jr., Port of Corpus Christi Commission Chairman.
According to the preliminary results from the Port Houston, 2019 was an exceptional year for this port as well.
Executive Director Roger Guenther said in December that the growth in containers was substantial, describing Port Houston as the fastest-growing container port in North America.
The container volume at Port Houston is expected to reach an all-time high of nearly three million TEU for 2019. Guenther added that Port Houston also ranked No.1 in North America for general cargo, handling breakbulk, special project, and steel, and was expected to record four million tons of volume by year-end.
The Port of New York and New Jersey hit record volumes in both rail cargo and overall container throughput for November. Total volume for November 2019 reached 599,626 TEUs, a 2.7 percent increase over the same period last year. The increase brings the yearly total to 6,886,388 TEUs.
From January through November 2019, imports at the Port of New York and New Jersey reached 3,497,971 TEUs, a 3.7 percent increase y-o-y.

Exports for the same period in 2019 reached 3,388,417 TEUs, a 6.0 percent increase y-o-y.
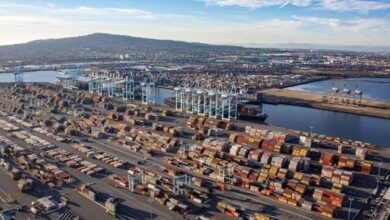
Despite experiencing some downturns in November due to the impact of tariffs, for the 11 months of 2019, the total volumes at the Port of Los Angeles increased 4% compared to 2018, which was the busiest year on record, the port said.
Furthermore, South Carolina Ports Authority had the best calendar year in its history, handling 2.44 million TEUs in 2019, a 5% increase year-over-year.
Breakbulk cargo was up nearly 10% from a year ago, RoRO transport was up 4%, while cruise passenger figures were up 24%, in 2019.
The Port of Virginia’s calendar-year-to-date growth was nearly 4 percent ahead of the same period last year, an increase of more than 98,000 TEUs.
The port’s CEO John F. Reinhart said in December that the port was on course to its fifth record-setting year for cargo growth.
| Import TEUs | 2018 | 2017 | 2017 | ||||
|---|---|---|---|---|---|---|---|
| 2018 Rank | Port | TEUs | % of Total | % of Change | 5 year CAGR | TEUs | Rank |
| 1 | Los Angeles | 5,039,363 | 17.40% | 5.40% | 3.10% | 4,782,737 | 1 |
| 2 | Long Beach | 4,364,771 | 15.10% | 6.80% | 3.40% | 4,088,296 | 2 |
| 3 | Newark/New York | 4,196,372 | 14.50% | 12.80% | 6.40% | 3,718,607 | 3 |
| 4 | Savannah | 2,223,628 | 7.70% | 10.80% | 8.90% | 2,006,610 | 4 |
| 5 | Houston | 1,811,737 | 6.30% | 6.00% | 5.50% | 1,709,831 | 5 |
| 6 | Seattle | 1,567,803 | 5.40% | 27.50% | 3.50% | 1,229,870 | 8 |
| 7 | Norfolk | 1,312,476 | 4.50% | 1.50% | 5.20% | 1,293,212 | 7 |
| 8 | Tacoma | 1,217,316 | 4.20% | -9.50% | -2.80% | 1,345,389 | 6 |
| 9 | Charleston | 1,210,214 | 4.20% | 2.60% | 6.00% | 1,179,170 | 9 |
| 10 | Oakland | 1,070,642 | 3.70% | 9.40% | 1.80% | 978,597 | 10 |
| 11 | Miami | 750,801 | 2.60% | 20.80% | 6.20% | 621,481 | 12 |
| 12 | Port Everglades | 728,461 | 2.50% | 2.00% | 3.70% | 714,199 | 11 |
| 13 | Philadelphia | 526,056 | 1.80% | 12.10% | 23.60% | 469,109 | 14 |
| 14 | Baltimore | 508,802 | 1.80% | 8.10% | 8.30% | 470,479 | 13 |
| 15 | New Orleans | 344,697 | 1.20% | 17.00% | 8.40% | 294,704 | 15 |
| 16 | San Juan, PR | 338,527 | 1.20% | 24.80% | 2.50% | 271,191 | 17 |
| 17 | Jacksonville | 266,226 | 0.90% | -3.70% | 4.10% | 276,319 | 16 |
| 18 | Willmington, DE | 196,994 | 0.70% | 3.40% | 2.90% | 190,508 | 18 |
| 19 | Mobile | 174,430 | 0.60% | 10.80% | 6.10% | 157,497 | 19 |
| 20 | Boston | 162,221 | 0.60% | 10.00% | 9.80% | 147,441 | 21 |
| 21 | West Palm Beach | 161,183 | 0.60% | 9.20% | 2.90% | 147,652 | 20 |
| 22 | Wilmington, NC | 125,863 | 0.40% | 36.20% | 2.80% | 92,409 | 24 |
| 23 | Chester, PA | 101,010 | 0.30% | -0.30% | 12.30% | 101,288 | 23 |
| 24 | Gulfport, MI | 100,189 | 0.30% | -6.90% | -0.90% | 107,660 | 22 |
| 25 | San Diego | 69,067 | 0.20% | 9.50% | 7.20% | 63,094 | 26 |
| 26 | Port Hueneme | 68,098 | 0.20% | -1.00% | 7.20% | 68,810 | 25 |
| 27 | Tampa | 50,450 | 0.20% | 33.90% | 17.20% | 37,686 | 28 |
| 28 | Freeport, TX | 47,217 | 0.20% | -2.60% | -1.80% | 48,500 | 27 |
| 29 | Honolulu | 37,449 | 0.10% | 18.80% | 8.50% | 31,518 | 30 |
| 30 | Everett, WA | 33,726 | 0.10% | -2.50% | 1.80% | 34,607 | 29 |
| National | 28,939,514 | 7.80% | 4.50% | 26,839,589 | |||
Source: Panjiva