By : Juan Carlos Croston
This article, by Seeking Alpha, should be part of every “introduction to container shipping” course: container shipping market by numbers
The global container ship fleet is estimated at 5,500 ships with a combined capacity to carry up to 23 million 20 feet containers, equivalent to 27 billion cubic feet or the volume of 730 empire state buildings at once.
Close to 45% of the fleet is owned by companies like Maersk (OTCPK:AMKBY) or COSCO (OTCPK:CICOF), the so-called “liners,” that charge their clients a freight rate for each container and voyage they contract. The rest of the fleet, 55% of that 23 million capacity, is in the hands of fleet owners that instead of using their fleet directly, they charter it for the use of the liners.

Fleet ownership is a capital-intensive business made on 25-year life assets that are very close to a pure commodity. Owners charter those assets to another competitive and commodity-like industry as the maritime freight of dry-non-bulk goods. Charter and freight rates are very volatile in general and the sector is populated by diverse manager teams and risky corporate structures.
Most of the vessels are property of SPVs in small countries, some of them are mere islands, where taxes are not really appreciated. Offices are normally in the Piraeus port of Greece and the ships tend to be flagged also in peculiar countries.
If that was not enough, ships require regular maintenance and they pollute our oceans as they move around burning cheap fuel which is not nice in this decade of ESG correctness.
There are not many pure container fleet owners as some of the biggest are private and others’ fleet is mixed with tankers or bulkers. I gathered info on Atlas Corp. (ATCO), Costamare (CMRE), Danaos (DAC), Global Ship Lease (GSL), and Navios Maritime Containers (NMCI).
Their combined market cap has gone from $10 billion at Dec-13 to $3.2 billion as I write this article, including $28 million from NaviosMC which was not public by 2013.

The two companies with longer track record in the stock market of that group are Danaos and Atlas Corp. In 2006, their combined market cap was $14 billion (EV of $15B) vs. the current $2.2 billion (EV of $6.6B); their latest combined LTM EBITDA is $1.093 million vs. $222 million in 2006.
The reason for writing this article started with Danaos. I invested in it after a quick template valuation and wanted to go deeper before investing more. The sector was more complicated than I thought so I split my article in two, one for the sector fundamentals and the next one for the company, to avoid an absurdly long article.
After this introduction you might be wondering why looking at such an ugly sector after all. Well, the reason is simple, it seems cheap and profitable for the investor and beyond all of its problems, the world cannot live without containers.
Marine Transport
Adam Smith already referred to the efficiency of water transport and the developments in ship technology in the 18th century. Marine transport is the cheapest way to transport almost everything.
It is said that ships carry 90% of everything that is used in the world. UNCTAD estimated that close to 12 billion metric tons are carried every year with container ships, bulk carriers, and tanker ships.
As explained in “Maritime Economics,” which I have used extensively for this article, it is a complex industry and the conditions which govern its operations in one sector do not necessarily apply to another, but there is usually some interchange at the margin which cannot be ignored.
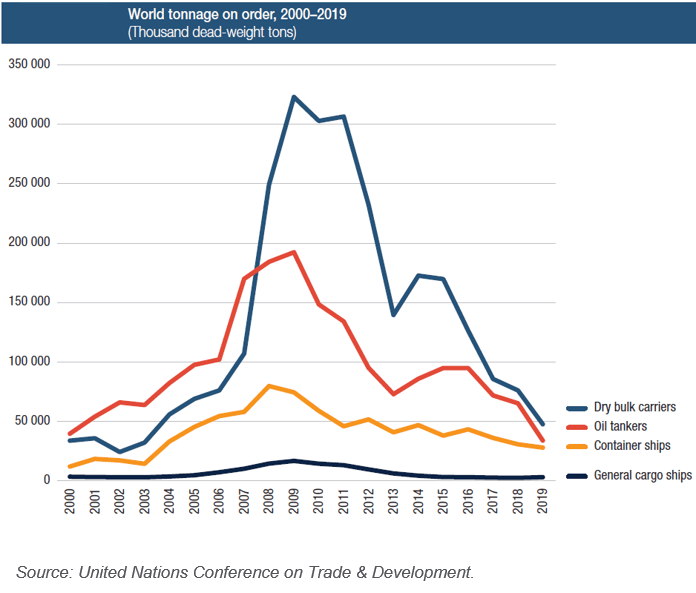
The world fleet for seaborne trade has evolved dramatically in the last 20 years. The growth in global trade that China brought into the world economy created pressure on freight rates that fueled an expansion in the fleet that extended its effects until 2010, well after the 2008 financial crisis had already burst.
Ships take 2 to 3 years for delivery. By 2008, what used to be the pride of every shipping company before the crisis, the new-build order book quickly became a business and financial risk that would have to be handled with care for many years.
In the case of containers, the new-build order book reached 53% of the total fleet capacity at that time. By then, freight rates and charter rates were already going down. Overcapacity would cast its shadow over marine transport for the whole following decade.
Before this last decade of overcapacity and concentration that took place after the 2008 financial crisis, there was a growing industry that started its incredible development 60 years ago when the first container was used.
The Container
As explained in the excellent book “The Box,” the container, which was first used in 1956, made shipping cheap by eliminating the old charge-discharge inefficiencies. Old marine companies were also crushed for the need to change their fleet and crews changed its weeks-days port stays into a few hours. Ports moved outside cities and became specialized super-efficient load-unload processing plants. All of that wave of destruction and creation out of a quite simple 20′ long, 8′ wide, and 8’66” height box.
The core of the container advantage is its efficiency to load-unload and to change from one vehicle to another without touching the cargo inside. The “box” is sealed at the factory of the user and only opened at the destination providing very efficient cargo management as there is no possible mix of cargoes. Standardization brought a new generation of ships that focused on its load-unload advantages and allowed for multiple times bigger boats.
That simple but powerful advantage changed the world economy. Containers brought sweeping reductions in the cost of moving freight cost, up to a point where it became almost irrelevant in business decisions which allows for specialization and scale economies on a global basis. This specialization brings added transport needs in return.
Currently, the most common sizes of containers are the 20′ and the 40′ boxes which measure the same in height and width but there is a myriad of specialized adaptation of those sizes to different uses, notably reefer (cooled) containers, or flat-rack containers.
The Ships
Ships are ranked by the number of 20 feet equivalent units of containers (TEU) they can carry.
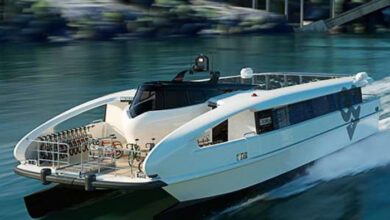
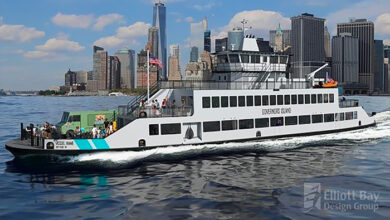
Container ships under 3,000 TEU are generally called feeders; small ships that typically operate between smaller container ports, collecting cargo from small ports, drop it off at large ports for trans-shipment on larger ships or distributing containers from the large port to smaller regional ports. This size of the vessel is the most likely to carry cargo cranes on board.
Then come the Panamax boats, of which size is limited by the original Panama canal’s chambers and which can take anything between 2,500 and 4,500 TEU.
Post-Panamax was developed in the late 90s to increase transport efficiency without using the Panama Canal. The maximum size quickly expanded from 6,600 to 9,000 TEU. As of today, they represent 30% of the global fleet by capacity.
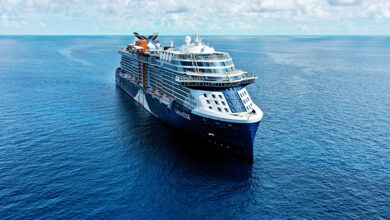
Then came ultra-large container ships that extended drought and beam up to the limits of the Suez Canal and brought capacities beyond 10,000 TEU. Currently, ULCS is considered to be beyond 15,000 TEU. In 2017 came the first ship with an official capacity of over 20,000 TEU, christened by Samsung, and at the end of 2019, the largest ships were a series of 11 MSC ships with a capacity of 23,700 TEU each.
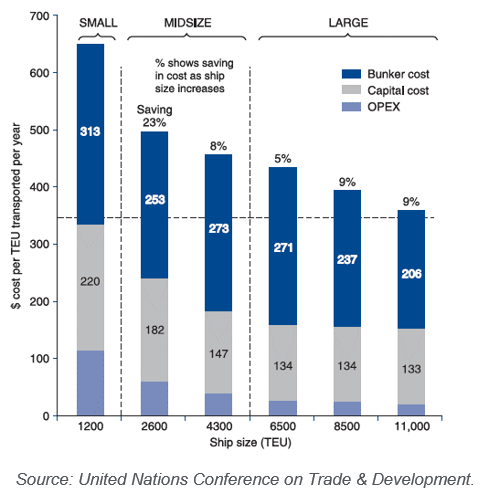
As you can imagine, the ship operative costs per TEU diminish as size increases. Full cost, including capital costs, can go as down as $350 per TEU for ships larger than $10,000, compared to $650 of a smaller 1,200 TEU ship.
 As of 2019, the container fleet is estimated to reach c. 23 million TEU in a total of roughly 5,500 ships. The share of the fleet capacity made up by ULCS (15,000 TEU+) has risen from 1% to 13% or 3 million TEU in the last decade.
The ports
A container terminal is a facility where cargo containers are trans-shipped between different transport vehicles, for onward transportation. Maritime container terminals tend to be part of a larger port, and the biggest maritime container terminals can be found situated around major harbors.
It is common for cargo that arrives to a container terminal in a single ship to be distributed over several modes of transportation for delivery to inland customers. As an example, in the Port of Rotterdam, it may be fairly typical way for the cargo of a large 18,000 TEU container ship to be distributed over 19 container trains (74 TEU each), 32 barges (97 TEU each) and 1,560 trucks (1.6 TEU each, on average).
Both maritime and inland container terminals usually provide storage facilities for both loaded and empty containers. Loaded containers are stored for relatively short periods, whilst waiting for onward transportation.
The bulk of the busiest container ports of the world have moved from Europe to Asia which currently has all top 10 container ports by volume of TEUs, according to the World Shipping Council. The largest one is the international port of Shanghai with 42 MTEU in 2018, way ahead of Rotterdam in Europe (14.5 MTEU) or Los Angeles in the USA (9.5 MTEU). The second and third are Singapore (36.6 MTEU) and Shenzen (27.7 MTEU).
Demand for container shipping, The Shippers
The container serves the need to transport manufactured and semi-manufactured goods which, compared to raw materials shipped in bulk, tend to be smaller parcels but with a higher value per parcel.
Manufactured goods are often shipped several times, first to assembly plants and to other plants for finishing and packaging and then for final delivery. The more efficient transport is, the more global manufacturing clusters develop, and even more, transport is generated to take profit from the specialization advantage. Clusters of specialization induced added global transport but at the same time are dependent on transport efficiency to keep its competitiveness.
The big gain for shippers in container ship cost came in the early 80s, after truck and train sectors were deregulated. This made them turn their head to the cartel-like sector of the carriers.
From the start of that decade to its end, freight rates plummeted globally, as much as 70% to 90% depending on the routes, despite world trade tripled in the same period.
From 1980 to 2005 container seaborne trade grew consistently at 9.6% p.a., from 102 million tons to ten times that at the end of that period. Since 2005, growth has been more moderate, averaging 5% p.a., but still above global GDP growth, global trade, and global seaborne trade volume.
As published by UNCTAD, a total of 1,935 million tons were loaded in containers in 2018. The factors that explain this phenomenal growth, well beyond economic growth, are cost reductions from economies of scale of the ships and port operations, de-regulation and competition of seaborne trade, and finally the specialization and increased use of global manufacturing clusters.
Economic growth remains the more significant factor explaining current growth in containerized trade volume since freight rates reductions and global specializations trends have exhausted or diminished their torque.
Any inefficiencies in the container industry itself that led to increases in freight rates or, more importantly, any induced inefficiencies in global trade that eliminate part or all of the competitive advantages of global manufacturing clusters could exert a negative pressure in seaborne trade and container seaborne trade in particular.
The Liners – Have they gone too far?
Liner companies, or carriers, provide global transport for cargoes that are too small to fill a single ship and need to be grouped with others for efficient transportation. Ships operate a regularly scheduled service between ports, carrying cargo at fixed prices for each commodity. Obviously, the management of that business is more complex than the bulk fleet operator and the required skills and organizations are quite different.
The routes can be grouped into three types:
- The East-West routes, that is transpacific, transatlantic, Europe to Far or Mid-East, North America to Mid-East, and Far to Mid-east.
- The north-south trades Europe, North America, and the Far East to southern hemisphere markets.
- The intra-regional trades within Europe, Asia, or North America.
Liners have to decide which routes and services to operate, which ships to use, and whether to own or charter those ships or to hire space with another liner. The main trends in the liner industry in the last decades are
- Concentration. Successive waves of consolidation have taken place in the last two decades. At the beginning of 2006, the four largest container shipping companies controlled 46% of the market in terms of TEUs, while as of the end of 2019 this is estimated to be 60%. All market concentration indexes globally or by routes point in that direction.
- Differentiation between larger and smaller fleets. The overriding trend of the past decade is the ever-increasing ship sizes in pursuit of economies of scale in the cost per TEU.
- Use of global alliances for full integration of service capabilities. They have made it possible for smaller players to get access to big ships. From the perspective of shippers that are clients of an alliance, the participation of shipping lines in an alliance has led to more deep-sea maritime services, ships per service, higher vessel size, and lower average round-trip duration, compared with services offered by operators not members of an alliance. At the same time, some surcharges policies have appeared that could compensate those advantages.
- Vertical integration of carriers in the logistic chain.
All these trends point in only one direction which is economies of scale or cost reduction. But there are some drawbacks to this never-ending trend:
- Decreasing returns from port investments to accommodate for the higher share of trade done in larger ships.
- Increasing problems linked to this growth concentration in larger ships. Routes, where these ships are profitable, are limited, essentially Asia to Europe routes, so prices for those routes suffer significantly creating added concentration and container congestion issues in the few ports that can handle such huge ships.
- Increasing demand for feeder services as bigger vessels cannot call at many ports and the ones they can call are becoming increasingly over-busy.
- For economies of scale to be delivered those ships need to be filled up which puts pressure on larger ship operators.
Besides previous problems the ULCS fleet is too young to hope for retirement, making it difficult to wait for time to fix the problem. The medium to smaller classes that can trade across a variety of routes and have a much better supply-side outlook are far better insulated for this sort of situation.
The Owners
For each kind of marine transport (bulk, specialized or liner transport) there is a primary fleet owned by the operators and a secondary fleet that is hired from independent ship-owners who only own the ships to charter them out without operating them directly.
In the case of the container fleet, close to 55% of the fleet is the property of non-operating owners and the rest is owned by the liners.
Ship-owners invest in a new or second-hand ship and try to get as much return from it as possible by chartering it to the liners for the maximum time and maximum rate possible.
Ships can be chartered in a time charter where the owner operates the ship fully under the instructions from the liner, which pays the time charter rate plus all voyage expenses. Ships can also be chartered on a bare-boat basis so the liner can put his crew on and operate the ship as if he was the owner, paying directly for all expenses and maintenance as a true owner would do.
Ships can also be chartered for a one-off voyage in the spot market.
When owners expect rents to increase, they will prefer to increase the weight of their charter contract portfolio in shorter time charters or even in the spot market. When rates are due to decrease, owners will prefer long-time charters.
Owners can buy ships in the second-hand market or more usually, especially in boom times, they can order new-builds to the main shipbuilders. They can buy speculative, with no charter in place for the new boat, or not.
Ship-owners can sell their ships in the second-hand market and they can sell it for the scrap value for demolition. Owners manage essentially three key issues:
- The fleet. Its characteristics, like ship type, age, technical improvements, or capex programs and so on. Increasing or reducing the fleet. They manage this with new ships, either used or new, and trading the ships already in the fleet.
- The contract charter portfolio. Managing renewal of existing contracts and choosing the different alternatives that the market might provide at each moment in relation with rate level and charter length.
- The debt portfolio linked to the fleet. Most owners finance most of its fleet with debt directly guaranteed by each vessel. Expansion decisions are easier to make then financing is abundant and cheap but that is typically when other owners might do the same thing. Financing tends to expand after some sound performance from liners and owners takes place helping to create boom and bust cycles.
All the previous decisions must be made in an evolving scenario with many moving parts as the charter rate market, the new-builds cost, the second-hand ship market, and the scrap market.
All these markets have their own dynamics but at the same time are related as players tend to adjust for their decisions according to what happens on them which at the same time has an effect in those markets.
Understanding where the cycle is and where is it moving to is a key management skill. Finding its own way to play it and avoid going where everybody is, by staying one step ahead of the competition, is crucial.
The shipping cycle – Nothing fails like success.
Marine shipping seems to be characterized by long periods of low rates due to excess capacity interrupted by brief moments of joy where companies rush into a shipbuilding spree that after some time re-establishes melancholy for the good times.
…businesses in industries with overcapacity and a commodity product are prime candidates for profit troubles. Overcapacity may eventually self-correct, …., but such corrections are often long delayed. When they finally occur, the rebound to prosperity frequently produces a pervasive enthusiasm for expansion that, within a few years, again creates over-capacity and a new profitless environment.
Warren Buffett
The shipping sector is characterized by intensive cycles, long and short in nature. The same factors appear time and again but rarely in the same way as they are not driven by a single economic model.
A cycle is created when supply cannot immediately adjust to changes in demand. New ships take 2-3 years to become operative since they are ordered. When demand for transport grows, it puts pressure on freight rates increasing liner returns and creating incentives to increase their supply of transport capacity. Before buying a new-build they will probably charter additional capacity which transfers the pressure on freight rates to charter rates.
When this extends long enough charter rates become too expensive and owners and liners themselves start to think in additional capacity from second-hand boats or, if they become expensive or are too old, from new-builds.
As ships take time to be ordered and delivered, freight rates and charter rates might continue to increase despite the increasing order-book of new-builds.
This delay is at the core of the shipping cycle. The balance between marine transport demand and supply must be found between the shippers and liners interaction, cleared in the freight rates market, and between liners and ship-owners, which is cleared in the spot and time charter market.
In my view, one of the problems at the core of the industry is in part with the owner companies, as managers do not play exactly the same game as its shareholders.
Despite they typically have a stake in the company they manage they have an exposure to fleet size from their management contracts. Typically, managers get a fee for every day the ship is chartered, a fixed dollar fee for each boat in the fleet and a fixed dollar fee for every ship they buy or sell.
So, without need of great analysis, it is quite clear that managers in comparison with a shareholder will tend to have larger fleets occupied at lower rates and with a higher rotation of traded ships.
Besides all the above, financing availability, technological change and speculative-conservative trends bring additional dispersion to the nature of each cycle.
Where are we in the shipping cycle?
Trade volume and Freight Rates
World GDP has been in positive territory since 2009. After a strong rebound in 2010 it has been moving in a 3-4% until 2020 when the Covid hit. Latest estimates point to a 5% drop in 2020 followed by a strong recovery in 2021, in line with the 2021 fall, but it is still difficult to have a clear view on how fast the pull-back to pre-Covid levels will be.
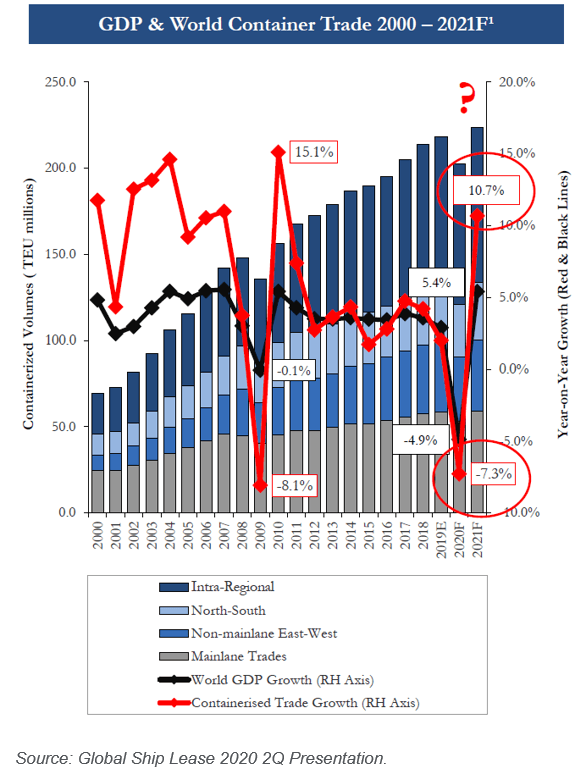 Container trade growth tends to move along GDP growth with wider swings up and down. According to MSI, the forecast for container trade is -7.3% for 2020 and +10.7% for 2021.
Freight rates, which have decreased close to 30% since the 2012 level despite the growth in container trade, but since mid-16, they have remained stable in a short range with small recoveries like in the end of 2018 or the end of 2019, that we can look more in detail in the second chart that discloses the China and Shanghai container freight rates index (CCFI and SCFI).
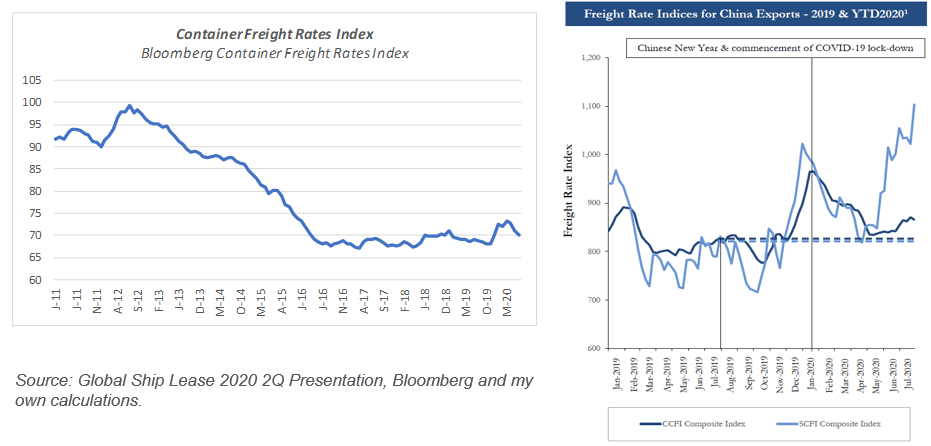
Those indexes are based on the different individual routes from China or Shanghai to the rest of the world. As we can see, from Sep-19 to Dec-19 rates spiked $200-300 per TEU and with the Covid effect in global trade, freight rates came back to the $800 level.
But after the worst of the crisis passed by, rates had a significant recovery, notably the Shanghai routes that have scaled back to $1,000 by June and are at $1,300 by now. China routes recovery has been milder and as of today stands at $900. I understand that the China index is broader and therefore more representative, perhaps, than the Shanghai index which covers fewer and more seasonal routes.
So, in the container demand-supply cycle we are probably in the low part of the cycle, pointing more to a recovery than to a continuation of the depressed scenario that has been in place since 2016.
Liner revenues and margins
This relatively positive situation can be confirmed by the evolution of revenues and margins of public liner companies. I combined the information from Maersk, COSCO, Hapag, Evergreen (OTCPK:EVEIQ), Yang Ming, Pan Pacific (OTC:DQJCF) and Wan Hay Lines.
Even taking into account that last two quarters have been affected by the pandemic situation, revenues and margins are considerably higher than they were three or just two years ago, as we can see in the following charts.
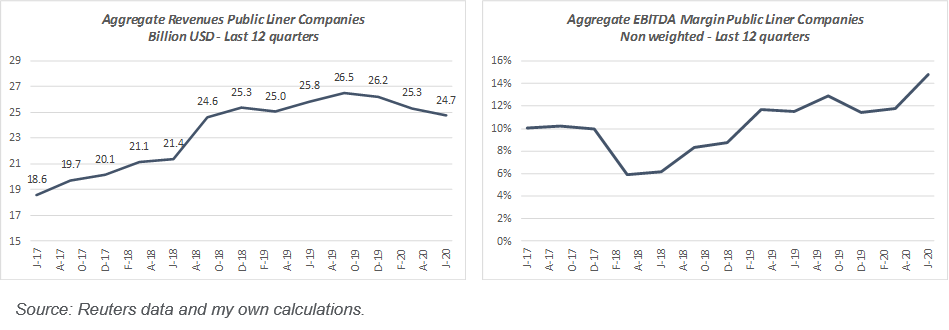
So, in conclusion, the sector is in favorable environment but still not overly positive. Rates have remained stable for quite a long time now and are even suffering some spikes from what can be looked as floor levels.
New-builds order-book
Despite that new-builds order-book is at historically low levels, capacity continues to grow no matter how concentrated the sector has become. The increase in capacity is especially focused on the ultra large segment of the fleet.
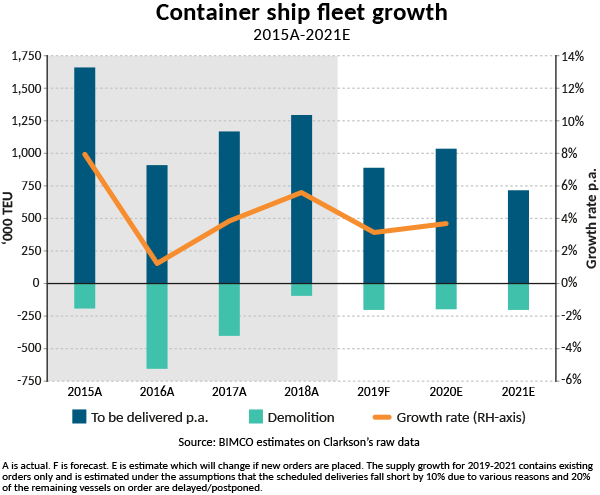
Order-book for new container ships compared to the total active fleet has never been lower than now, according to Alphaliner. There are close to 5,500 container ships worldwide with a total capacity of 23.9 MTEU while confirmed new fleet orders are 2.4 MTEUs or 10% of the world fleet capacity.
If maximum useful life of a container ship is roughly 25 years, the equivalent replacement rate is 4% p.a., so 10% implies a 6% net growth. In this article from BIMCO the net balance between future deliveries and demolition of old ships is shown. As can be seen in the graph, despite all the problems of the industry, it is expected that net growth will be in positive territory in 2020 and 2021:
As we have seen, managers do not get paid on the return on capital but mostly on fleet size.
Though managers are also shareholders and tend to have significant stakes in the companies which mostly compensates this divergence, it is easy to understand why managers tend to be overly positive as soon as there is some recovery in the market and tend to grow their fleets simply too quickly.
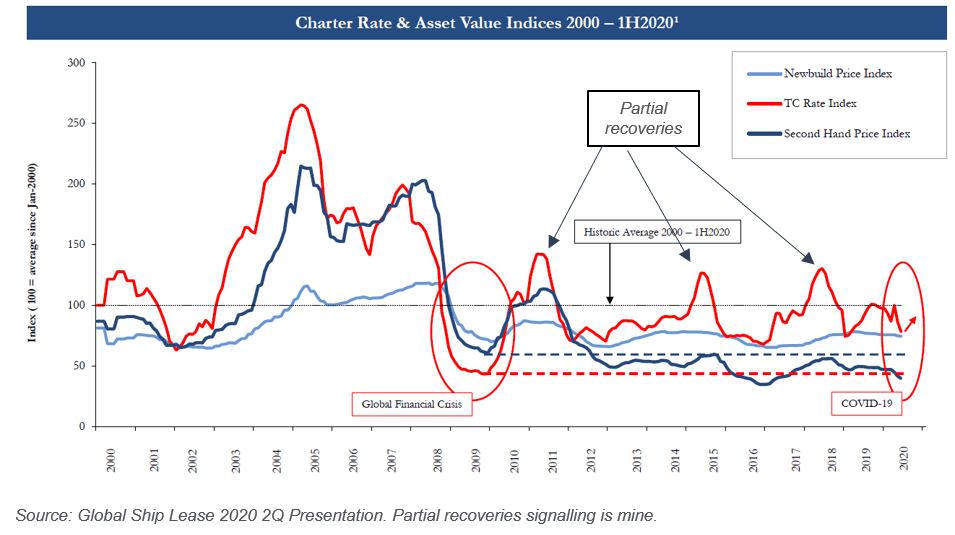
Charter rates
Looking to the time charter rates since 2000 we can see that after the great boom of 2005 rates decreased sharply in the following four years, reaching a trough by mid-2009. Since that trough, three smaller cycles have taken place: from 2010 to 2013, from there to 2016 and from there to 2019.
Charter rates are now slightly below the average for the last two decades, clearly above the trough levels of 2009 but also extremely far from the peak of 2005.
My outsider view is that it is quite probable that we are at the beginning of another upward cycle in charter rates and that maybe it could go a little bit further than previous peaks as order-book and financing conditions for new-builds are in tighter conditions now than they were in 2013 and 2016.
By the same token I do not think it would be wise to assume a recovery to rates resembling the peak of 2005 that in my opinion, must be read as a several decade cycle peak of global trade development that started back in the 70s coupled with containers getting close to 100% of the manufactured and semi-manufactured global trade.
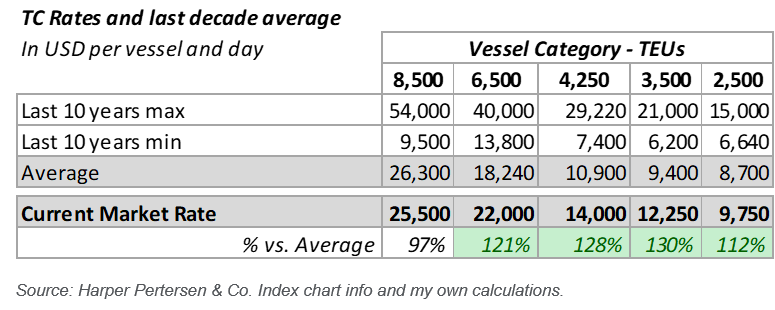
Looking more in detail at rates for different ship sizes as reported by Harper & Petersen, we can see that current rates are 20-30% above last 10 years’ average except for the +8,500TEU class.
Conclusion on the cycle
Market players tend to read recoveries more positively than they are and move quickly into additional new capacity, or bigger ships, or newer ships, as soon as they feel things are improving.
Most presentations of liners and ship-owner companies insist on the idea that order-book of new-build ships is at historically low levels but that is only if you compare it with the almost crazy times before the 2008 financial crisis.
The reality is that the fleet in terms of available TEU continues to grow, even at only 4% to 6%, especially in the ultra-large segment. And for the fleet to grow at those rates without punishing charter rates, you need a healthy 3% growth in world GDP.
My view is that once the Covid effect passes, growth will recover most of the lost ground and that global trade will also recover to previous levels. That should allow for some tailwinds on the freight and charter rate markets recovering the cycle recovery situation of the second half of 2019.
So yes, I think it is possible to be objectively positive at this point. There are two additional factors that allow for some more confidence, and which were not so present in the failed recoveries of 2011, 2015 and 2018:
- The oversupply of capacity is more concentrated in the ULCS category. In that size type there is less occupation on the routes they work (mostly Asia-Europe). Fleets are younger so oversupply will be persistent on this segment of the supply, putting some pressure on liners to avoid increasing fleet size too soon.
- There is no easy equity access by fleet owners. Values are low, making it dilutive to issue new equity. The world is focused on FAANGS and there is no need to invest in the old and ESG no-good-looking shipping companies.
- Banks are not eager to finance either. The pain they have gone through with the sector since 2008 is not easy to forget. Companies are quite levered and unencumbered collateral for new debt is scarce. Besides, after a decade of declining ship values, who really likes that guarantee. Better to finance private equity acquisitions at 90% with little more than a soft comfort letter.
So maybe this time the recovery cycle is more durable than in the previous attempts. But only maybe. I would not bet for a disciplined behavior by all market players in favor of a clear recovery in shareholder returns. That would be too optimistic, in my opinion. Let us just wait for a few good years.
There is no need for much more for EBITDA to remain stable, debt amortized and fleet values recovered. That moderate scenario could bring a lot of value to shareholders.
Disclosure: I am/we are long DAC. I wrote this article myself, and it expresses my own opinions. I am not receiving compensation for it (other than from Seeking Alpha). I have no business relationship with any company whose stock is mentioned in this article.